
Trying to Figure Out Where Pernod Ricard Really Makes Money
I may have underestimated how challenging this would be without any first-party data...

Apologies for the delay, everyone; it’s been a crazy few weeks. But we’re back to our regularly scheduled programming of diving deep into the business of Pernod Ricard.
We’ve established that Pernod Ricard is a very profitable enterprise, as one might expect from the “most valuable premium spirits manufacturer in the world.” And so in some ways it is not surprising that the company talks almost exclusively about its sources of revenue and sales trends and almost not at all about where it generates profit.
When 1 of every 4 dollars you bring in comes out as true profit, you don’t much care about the details!
That is not the case for most companies generally, and certainly not the case for most of the companies I’ve worked with and for specifically. But it’s an interesting situation to be in!
Most companies make a ton of profit in one piece of their business and hemorrhage in another. “Strategy” for these companies is usually about balancing their “mix” of sales in those areas so that the company is aligned to grow in the profitable areas first and thereby produce incremental profit. That’s often supported by cost reduction, efficiency gains, price increases, or some combination of those to improve the places where they’re losing money as well. But that’s not really the strategy, those are just activities that support the strategy that’s all about selective growth.
But when you’re profitable everywhere, as Pernod Ricard seems to be, you can afford to be much less picky. You’re just chasing growth at almost any cost. And that’s clearly what Pernod Ricard is doing! They buy multiple brands a year hoping to find a massive growth rocket because they know they can’t really lose money. Strategy for them really boils down to “find and own the next big thing.”
I think this is going to need to change, at least in the United States, because they are no longer supported by legendary tailwinds. There are fewer and fewer new brands, shelf space is more and more crowded, and volume is coming down. Americans are drinking less overall, and when they do there’s ever more competition for their dollars.
Pernod Ricard is going to have to start caring about where they truly make money and get more focused to have a successful long-term US business. The days of unfocused acquisition and trend chasing are going to give way to more fundamental management.
And I’m going to give it a go on what that might look like based on what they share today.
The Easy Part: Regional Profit
In one of their annual reports, at the very end (page 119 of 126), you can finally find something that tells you where profit is really coming from. But it ain’t much:
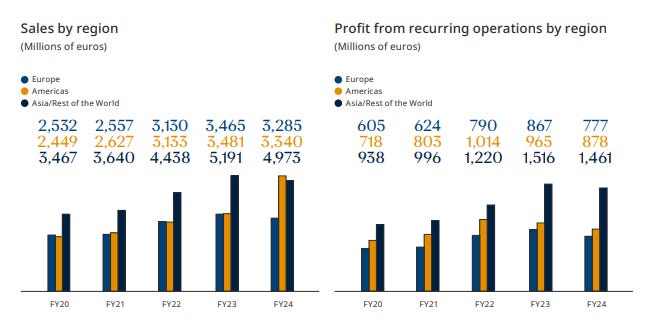
But presented like that, it’s very hard to make sense of. So let’s translate to this instead:
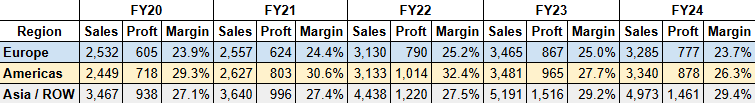
There’s an interesting moment here that’s hard to see in the table, so let’s do this:

Asia / ROW overtook the Americas as the most profitable region in FY23. Asia / ROW profit is experiencing steady growth, but in the Americas something happened in FY23 that sent profit off a cliff.
The other annual report I can find tells a similar story, though the details are a bit different. I won’t recreate all the visuals, but the general idea I get from that report (on Pages 43 and 44 of 55) is still that FY24 is the first time that the Americas generated a lower margin than the total business. And there could be a core reason: promotional spend.

Look how much more the Americas spend on advertising than anywhere else! And it’s going up, vs going down in Asia / ROW. This very much looks like the Americas are having to buy their revenue with ad spend (also in Europe), but Asia / ROW is growing more organically. And that, as a result, makes the profitability of Asia / ROW much more attractive.
The Hard Part: Profitability in The Americas
So we know that profit is generally a bit of an issue in the Americas, but we don’t know how much of that might or might not be a US problem. And even from there, we don’t know if there are specific product categories driving that. Basically, we have no idea what kind of profitability / attractiveness indicator we can put into our Market Map.
To be fair, that’s true for any financial metric; it’s not like I’ve found a way to fill that in for sales or sales growth either. That’s why I initially just used Brand Count as the base; it’s basically a proxy for sales. But I found a nugget here that may give me a clue.
Pernod Ricard considers the US a “Must Win Market,” so there’s a bit more commentary than for most. And there’s a single bullet that stuck out to me in one of the presentations:
Acquired brands Jefferson’s & Código enjoying growth, Skrewball marketing campaign launched in May
That reference of “acquired brands” is the only one I can find in reference to any financial performance. It’s straight up the only time “acquired” is used in either report!
It seems likely to me that recently-acquired brands are generally less profitable than others because they consume more promotional dollars as they’re integrated into the portfolio.
So, I think a decent proxy for relative profitability in the Market Map is going to be some kind of “average brand age” - looks like I’ll need a full timeline of brand acquisitions by category.
Next week, that’s what we build!