
The Mixing Ingredients Alcohol Market Map
Turns out, a simple grid is often the best way to start really understanding an industry

I have written about alcohol in some form or fashion for about 7 years now. And I’ve worked professionally in some form of “strategy” role for at least that long as well. But for some reason, I’ve never really thought about crossing those streams.
My writing has (obviously) often been a bit of an escape from work, an outlet for creativity that isn’t usually available in a buttoned-up corporate setting. But recently, that’s felt more limiting than liberating; I truly enjoy a lot of my work, I truly enjoy my vignettes in the state of alcohol today, and I really do want to start combining these things. But, I still want to have fun with it. So that’s what we’re going to be doing for a while.
What’s a Market Map?
It’s just a grid that represents the unique aspects of any given market. The market map for a business is their “playing field", and strategy is really about choosing which spots on the grid are right for you to focus on growing / defending / exiting. It’s a simple visualization that still often takes quite a while to get everyone to agree on. Very few businesses are truly in a single industry, and so every market map ends up being customized for each individual business.
But you’re not clients and I’m a dictator in these pages, so I’m not going to worry about that nuance.
For me, it always makes sense for the Rows of a Market Map to be the products and the columns to be the channels and / or geographies. For MI, I’m always going to be more focused on the rows (products and product categories). The columns are less important overall because 1) I can only go directly observe what’s in the US and 2) channel management in booze is a whole thing, it’s very dumb, not at all interesting, and I just don’t want to constantly talk about distributors.
What Fills In a Market Map?
If the Market Map is really just a grid, what goes in each cell? Possibilities are pretty much endless; just about any metric the business tracks (or should track) can be mapped to any cell. But for my work, I’m usually focused on the following:
Market Size - how big is the intersection (sometimes this is just done at profit, rather than volume or revenue, and we call them “profit pools”)? Sometimes, current sales is a good enough proxy to start with.
Market Economics - how profitable do we expect the intersection to be for the business? Usually, current profit margins are the right way to represent this (but often with some tweaks).
Competitive Positioning - what is the business’s “right to win” against their competitors in this intersection? This one really has no good stock metric, and it’s usually populated by a combination of survey work and qualitative analysis.
The combined output of these 3 things is usually a cool 2-by-2 matrix with differently sized bubbles with most of the obvious answers being “focus on the big stuff that’s furthest up and to the right.” Often, strategy is also about how to move bubbles up and / or to the right as well.
The MECP Framework
This combined output is often called the MECP (Market Economics and Competitive Positioning), and it’s a very powerful tool as the guiding structure for a strategic assessment. Here’s an example:
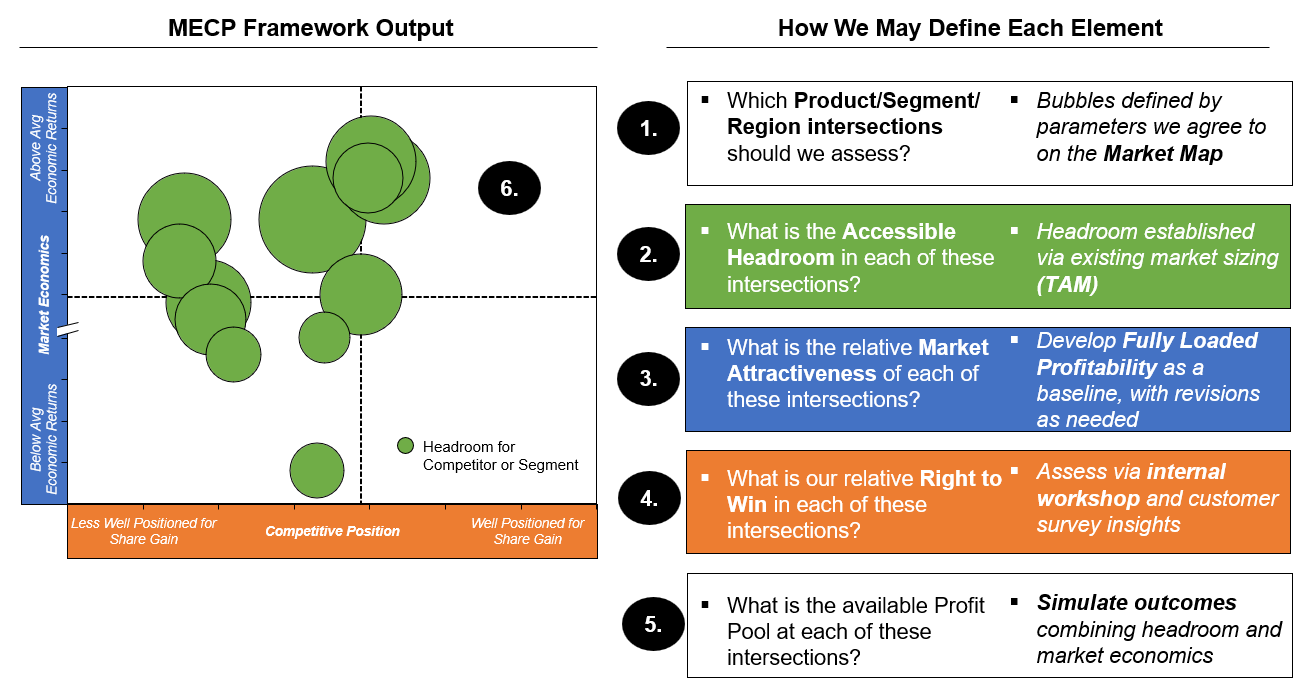
I really don’t know what pretty outputs I’m going to care about building, but I expect I’ll be making quite a few of these…
The Mixing Ingredients Alcohol Market Map

That’s 4 major categories, 25 detailed subcategories, and 6 distinct geographies. That’s a total of 150 potential intersections, and I don’t think there’s a single company out there that plays in all 150. I’d be surprised if there are many that play even in half of that. I also don’t think it’s realistic for a project of this scale to develop any “full market” view, but I’d like to build up to that as best I can over the course of this series.
Overall, though, my focus is really just going to be on the US column because that’s what I can directly do “field research” on and bring some real context to.
Many of the companies I’ll be talking about are global, though, and I’ll bring that context in where it matters. 25 intersections to discuss will still be more than enough for each company, and even then I’m a bit worried about how much information I’ll be able to find to fill them out.
Potential Companies for Analysis
Because these things really only work if we can at least approximate size and profitability, and because I have absolutely no proprietary data to work off of, companies I analyze for this really need to be public. Even better if they’re not primarily listed in the US, because annual reports are much more interesting if they’re less subject to all of the FTC-required boilerplate. Here’s the list I’m looking at:
Pernod Ricard
Diageo
Brown-Forman
Becle S.A.B.
AB InBev
Heineken
Molson Coors
Asahi Group
Constellation Brands
Boston Beer Company
Splash Beverage
That’s 11, and I’m sure I can find a 12th, so we may be looking at a whole year of this if it goes well. And if it doesn’t, or if I get bored, then it won’t! Not committing to a full year on a single bit again…
What Each Analysis Will Look Like
I’m not entirely sure yet, but I expect that each company I look into will have posts dedicated to the following:
Company Overview and Strategic Hypotheses
Field Research and Tasting Notes
Revenue and Profit Breakdown
Competitive Positioning Assessment
Thoughts On Growth